
Most buyers and sellers in GV don’t compete in the market they think they’re in. Only compete against a very small group of buyers or sellers chasing the same few properties.
Once understand which market you’re actually in, 2026 becomes far less uncertain — and far more navigable.
If you are like most consumers, decisions are often based on headlines, while real outcomes are decided in much smaller, tighter pockets defined by price, property type, and neighbourhood. That disconnect cost people leverage and options in 2025.
If you’re planning to buy or sell in the City of Vancouver, this distinction matters more than any forecast.
The Three Beliefs Driving Most Decisions Right Now
If your information is coming mainly from news reports or social media, you’ve likely absorbed three common beliefs:
Inventory is sky-high
The market strongly favors buyers
Prices are crashing
These beliefs are not universally wrong — but inside the City of Vancouver, they are often misapplied.
Mistake #1: Assuming “Greater Vancouver” Means the City of Vancouver
Most headlines refer to Greater Vancouver, not the City itself. Those statistics combine 17 municipalities, each with different supply, demand, and pricing dynamics. Condos in Surrey do not move like detached homes on the West Side. East Vancouver townhomes don’t behave the same way as West Side ones.
Vancouver real estate is not one market. It is a collection of micro-markets.
Treating it as a single system leads to false confidence — and missed timing.
Mistake #2: Believing High Inventory Automatically Means Choice
Yes, inventory rose across much of Vancouver in 2025. On the surface, that supports the idea of a buyer-friendly market.
But inventory only tells the truth after budget is applied. When inventory is filtered properly, the picture changes.
For example, East Vancouver one-bedroom condos under $550,000 ran below their long-term average, despite city-wide inventory growth.
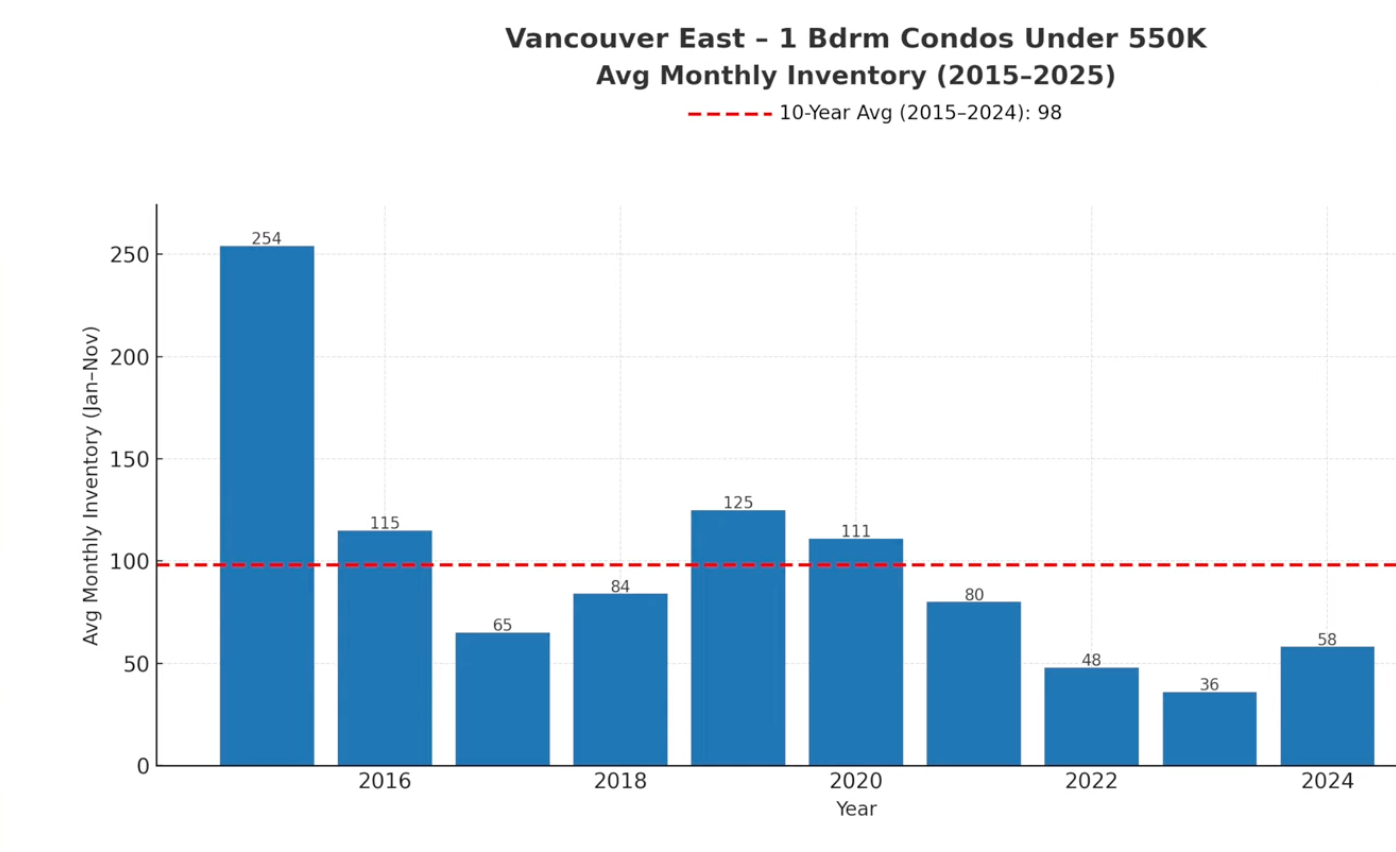
Inventory existed — just not where many buyers were actually competing.
This is where waiting backfired. Choice didn’t expand. It narrowed.
Mistake #3: Ignoring the Stat That Actually Signals Leverage
Inventory shows availability. Leverage shows up in the sales-to-active listings ratio.
Looking at 2025 inside the City of Vancouver:
Condo markets on both sides of the city remained balanced
Townhomes varied sharply by side and price point
Detached homes leaned buyer-favourable, especially on the West Side. But averages hide what matters most, sale ratio matters
Townhomes varied sharply by side and price point
Detached homes leaned buyer-favourable, especially on the West Side. But averages hide what matters most, sale ratio matters
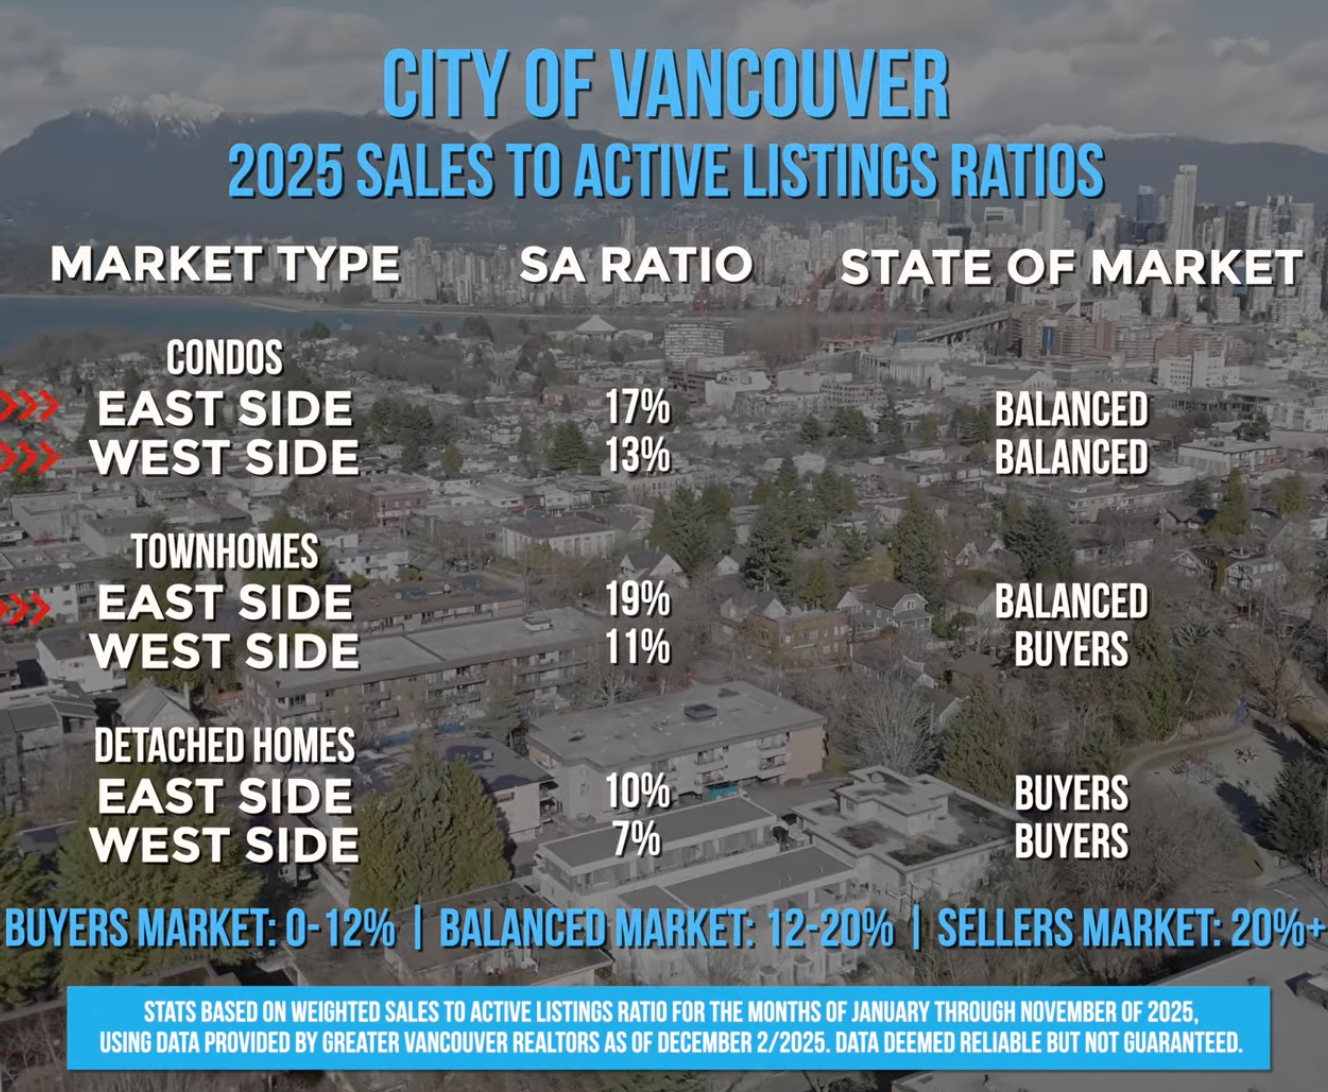
Several budget-specific segments never moved into true buyer territory, even while broader ratios softened. Buyers negotiated as if leverage was obvious — while competing in pockets where demand stayed firm.
Prices Didn’t Crash — They Corrected
Benchmark prices did decline in 2025, but this was a correction, not a collapse.
Some properties adjusted meaningfully.
Others barely moved.
Some did not move at all.

This leads to another costly assumption.
Mistake #4: Treating Benchmark Prices as Your Price
Benchmark prices track a typical property — not your home and not the one you’re buying.
That “typical” property varies by: Neighbourhood-Property type-Buyer profile
Mistake #4: Treating Benchmark Prices as Your Price
Benchmark prices track a typical property — not your home and not the one you’re buying.
That “typical” property varies by: Neighbourhood-Property type-Buyer profile
Benchmark prices are meant to show trend and direction. They are not a pricing formula and not an offer calculator.
Using them that way caused hesitation for sellers and false confidence for buyers in 2025.
What Actually Matters Heading Into 2026 ?
Clear decisions in Vancouver come from narrowing the lens ( hire a realtor early in the process)
Inventory within your budget
Sales momentum in your neighbourhood and preparation equal capitalize on equity gained.
Price behaviour for your property type
When those three align, leverage becomes visible — and actionable.